What Is HPLC?
Separating compounds to identify and measure them
HPLC stands for High-Performance Liquid Chromatography. In simple terms, it is a technique for separating the individual components of a liquid mixture so each one can be identified and measured independently.
Think of it like a race. You dissolve your sample in a liquid (the mobile phase) and push it through a tightly packed column at very high pressure. Different compounds travel through the column at different speeds — some stick more to the packing material, some less. By the time they reach the end of the column, they have separated into individual bands, each arriving at a different time.
A detector at the end of the column measures each compound as it passes. The result is a chromatogram — a graph showing which compounds were present and how much of each.
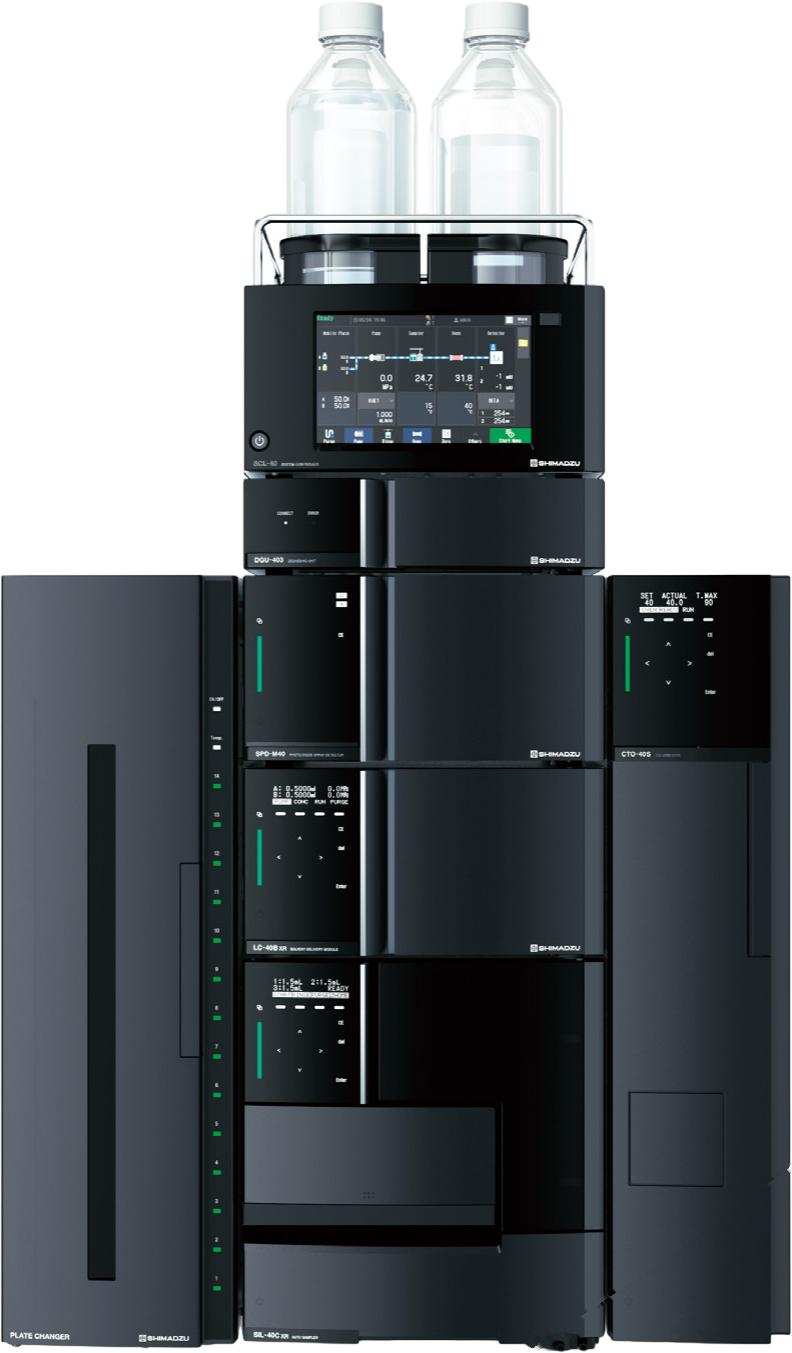
Shimadzu Nexera LC-40 — the UHPLC system used at ANALITIKA
The Instrument
What each module does
A modern UHPLC system like the Shimadzu Nexera is made up of several connected modules, each with a specific role in the analysis.
Solvent Delivery Pump
Pushes the mobile phase (typically water + acetonitrile) through the column at precisely controlled flow rates and pressures up to 130 MPa. The pressure is what gives HPLC its speed and resolution.
Autosampler
Automatically injects a precise, reproducible volume of your dissolved sample into the mobile phase stream. Carryover between samples is less than 0.0003% — critical for accurate back-to-back testing.
Column Oven
Holds the analytical column at a precise, stable temperature throughout the run. Temperature affects separation — keeping it constant ensures every run is directly comparable to the last.
Analytical Column
The heart of the system. A stainless steel tube packed with microscopic C18-bonded silica particles. Compounds interact differently with this surface, which is what causes them to separate.
PDA Detector
A Photodiode Array detector that shines UV light through the column eluent and measures how much is absorbed at 1,024 different wavelengths simultaneously — detecting compounds as they exit the column.
System Controller
A touchscreen controller and data system (LabSolutions) that orchestrates every module, captures the raw signal, integrates peak areas, and produces the chromatogram data used in your report.
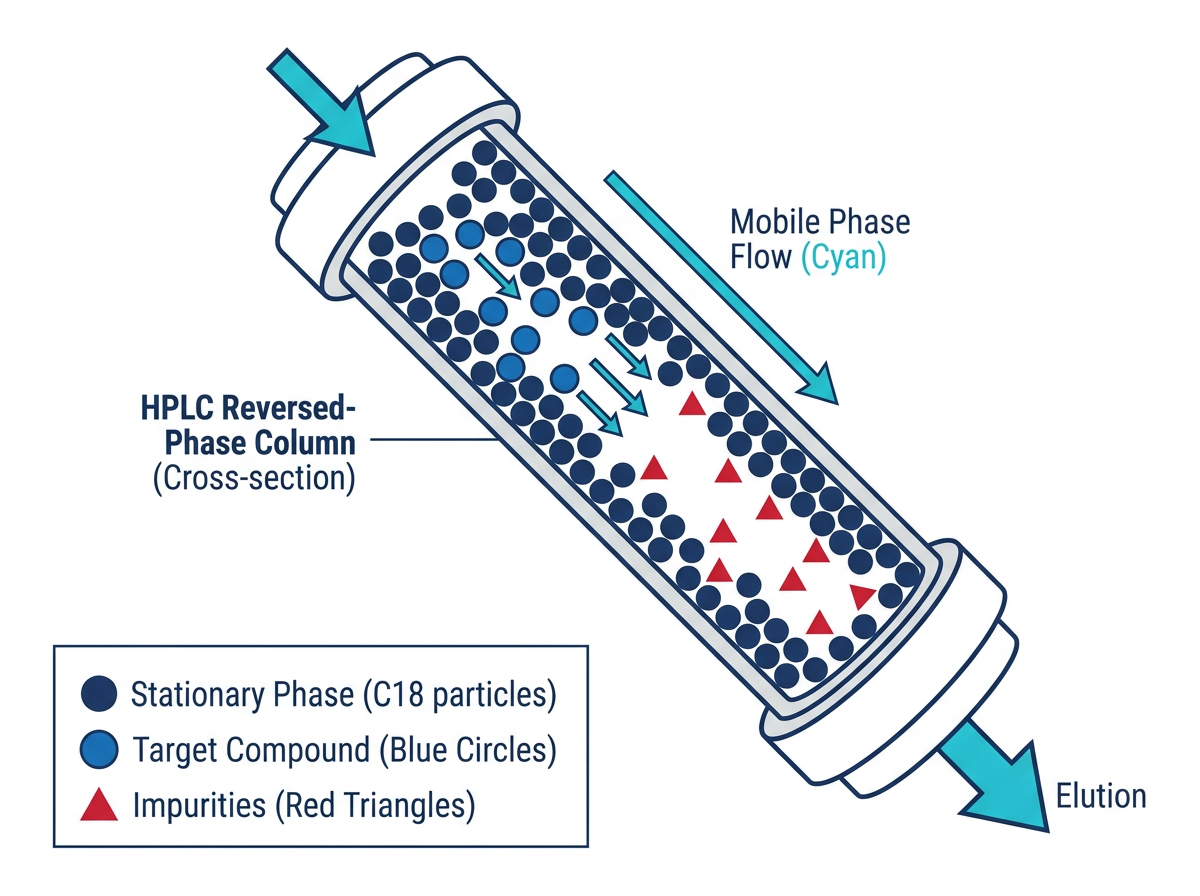
Compounds separating as they travel through the reversed-phase column
The Column
How reversed-phase separation works
In reversed-phase HPLC, the column is packed with C18-bonded silica particles — essentially microscopic beads coated in a waxy, non-polar surface. The mobile phase flowing through is a polar mixture of water and organic solvent (typically acetonitrile).
When your sample enters the column, each compound within it partitions between the mobile phase and the C18 surface based on its own polarity. More non-polar compounds stick to the waxy surface longer, eluting (exiting) later. More polar compounds prefer the aqueous mobile phase and elute earlier.
By the time a compound reaches the detector, it has been physically separated in time from everything else in the sample — so each compound produces its own distinct signal.
The Chromatogram
Reading the output
The chromatogram is the raw output of the HPLC run — a graph with time on the horizontal axis and UV absorbance on the vertical axis. Each peak represents one compound that passed through the detector.
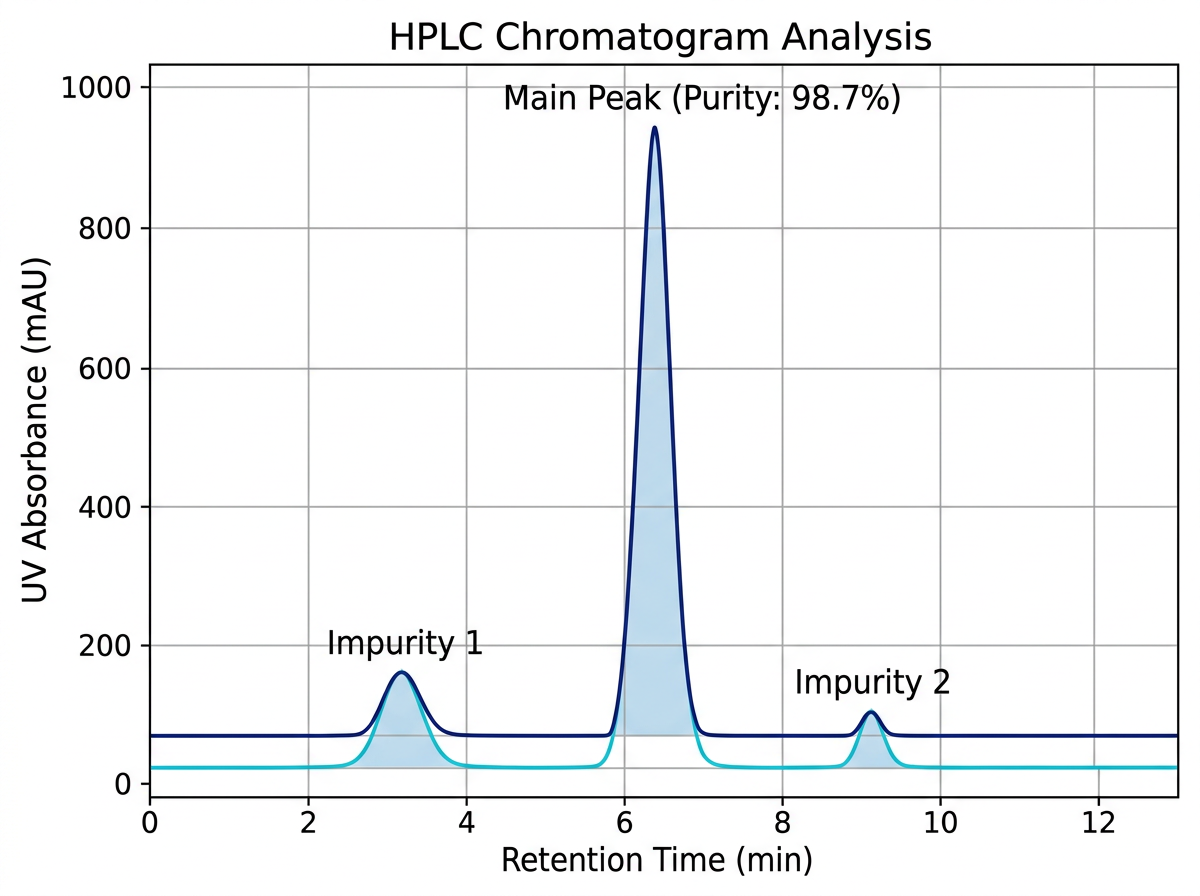
Example chromatogram: one main peak (98.7% purity) with two small impurity peaks
The Calculation
How purity percentage is derived
Purity is calculated using the area percentage method — one of the most widely accepted approaches in analytical chemistry.
Integrate all peaks
The LabSolutions software automatically calculates the area under every peak in the chromatogram, including the main compound and any impurities.
Sum all areas
All peak areas are added together to get the total detected material in the sample. This is the denominator in the purity calculation.
Divide and express as %
The area of the target compound's peak is divided by the total area, then multiplied by 100. The result is the chromatographic purity percentage reported on your COA.
Your Results
What your Certificate of Analysis contains
Every COA issued by ANALITIKA is a complete, traceable document. Here is what each field means.
Ready to submit your sample?
Create a free client account and submit your first test order. COA delivered in 3–5 business days.